A summary of a line graph

A summary of a line graph

Learn how to describe a line graph.

Do the preparation task first. Then read the text and tips and do the exercises.

Preparation

Reading text

The graph below shows how people buy music. Summarise the information by selecting and reporting the main features, and make comparisons where relevant.
A summary of a line graph

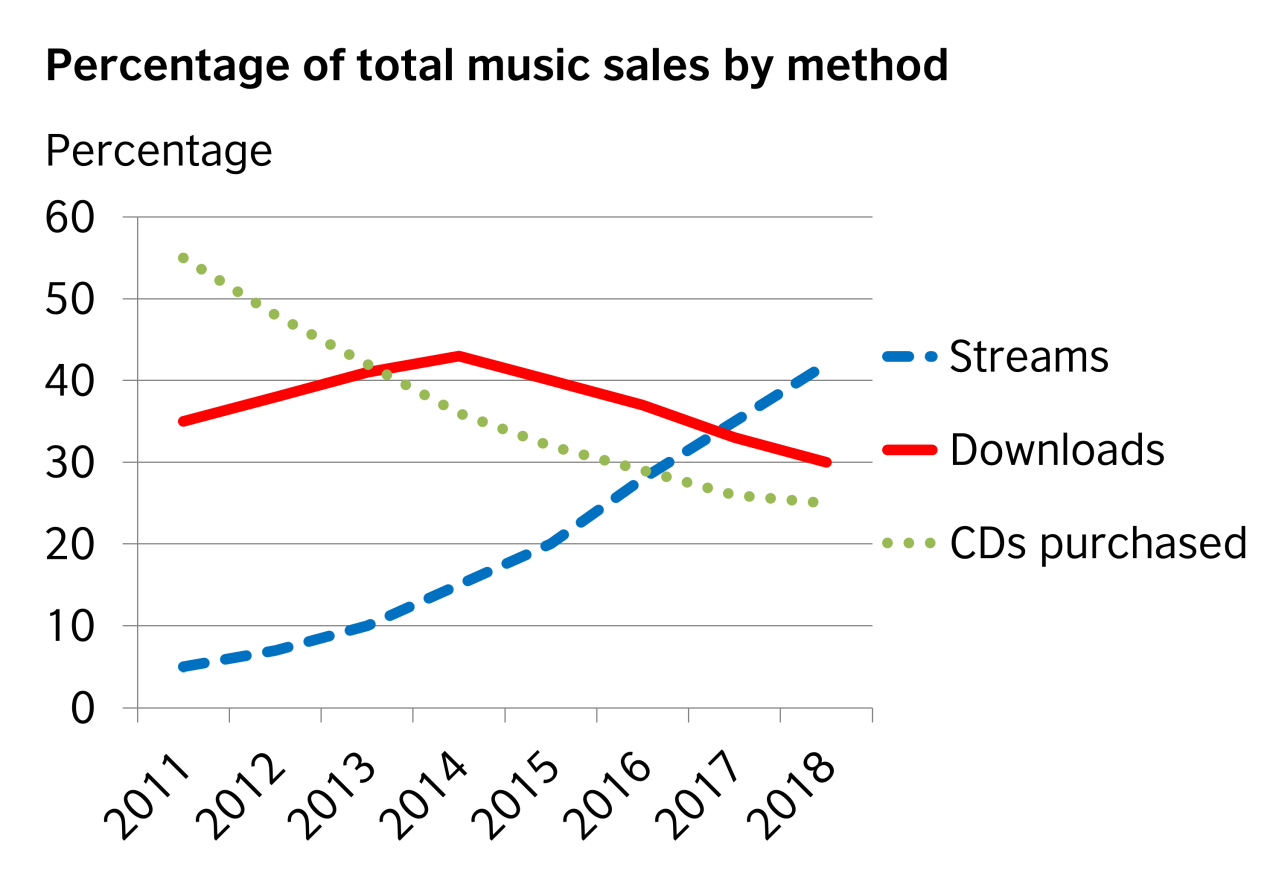
The graph illustrates trends in music buying habits between 2011 and 2018. It presents three different methods: streaming, downloading and buying CDs.

Overall, both downloads and physical sales of music have steadily declined. The latter has slumped since 2011, while the downturn for the former began in 2014. However, there has been a sharp rise in people streaming music since 2013.

In 2011, the majority of music sales were of CDs, at 55% of all sales. In contrast, streaming was not common at all at only 5%. Also, although people had started to download music, it only represented 35% of sales. As sales of CDs began to fall, downloads started to rise. They rose steadily and downloads overtook physical sales in mid-2013. During the same period, streaming doubled to 10% but then it started to grow more dramatically.

Downloads peaked in 2014 at about 43% of sales but fell to 30% by 2018. This was slightly higher than physical sales, which shrank to 25%. Streaming, on the other hand, overtook both of them and accounted for just over 40% of sales in 2018.

Please note: This page was designed for writing practice only. Information in the graph may not be accurate.

Tips

  1. Change the words in the question to introduce your answer, e.g. This graph shows = This graph illustrates.
  2. The second paragraph should give an overview of the main points the graph shows (imagine you're describing the results to someone who can't see the graph).
  3. The following paragraphs should describe the main patterns or trends in more detail.
  4. Use precise vocabulary like steadily declined and a sharp increase to describe trends. Use linking expressions like while and in contrast to make comparisons.
  5. The question asks you only to 'Summarise the information'. Don't give reasons why these trends might have occurred, or your personal preferences on the topic.

Discussion

Download
Worksheet154.78 KB

Language level

Average: 4.2 (13 votes)
Thanks again for the explanation. So the writer could say that: However, there had been sharply rising in people streaming music since 2013. Am I correct.

Hello mxoubi0,

No, I'm afraid that's not correct. After there + be (such as there had been) you need a noun phrase, so you need a sharp rise not a verb phrase.


Also, with regard to the past perfect, you need to have a second time reference. The past perfect is not used on its own. It exists with reference to a second past time. If you simply say since 2013 then you are describing a time which continues up to the present, not a past time which continued up to another past time.


Peter

The LearnEnglish Team

Profile picture for user Jonathan R

Submitted by Jonathan R on Wed, 12/08/2020 - 04:34

In reply to by Razan Mahairy

Permalink

Hi Razan Mahairy,

I'll try to help. Physical sales means the sales of a object that you can hold or touch, like a music CD. If you buy music online, this is not a physical sale because you just get a file (e.g. an MP3), not a physical object.

Streaming means listening to music or watching a video online, on YouTube, for example. When you stream music, you don't own the music.

To develop your vocabulary, reading and using a dictionary is great! Do you have a vocabulary notebook? If not, I recommend making one – a notebook specially for vocabulary, separate from your other learning notes. Add new words and phrases in it, with notes about their meaning, usage, pronunciation, common phrases, and anything else important. Then, review them often and test yourself. Also, look for opportunities to use these words and phrases in your own writing and speaking.

Best wishes,

Jonathan

The LearnEnglish Team

Profile picture for user OlaIELTS

Submitted by OlaIELTS on Thu, 07/05/2020 - 01:30

Permalink
The trends has been on an increasing rate for patronage on mostly streaming and downloads.

Submitted by Huini on Fri, 24/04/2020 - 05:54

Permalink
This report presents the cellphone using trends from 2010 to 2019 in a developing country like Bangladesh. It shows three different cellphones selling methods: Nokia, Samsung, and iPhone. Overall, Nokia has steadily declined since 2010. In contrast, Samsung has slightly increased from 2010 to 2014 and sharply grown from 2015 to 2019. However, there has been a sharp rise in buying the iPhone since 2017. In 2010, the majority of cellphone sales were Nokia, 75% of all sales. In contrast, Samsung was not popular at all at only 8% and the iPhone was not invented. Although people had started to use Samsung, it only represented 28% of sales. As Nokia began to fall, Samsung started to rise. After 2013, it has steadily increased and overtook Nokia in 2016. In 2019, Samsung represented 65% sales, while Nokia almost stopped selling its phone, at only 1% of all sales. Meanwhile, the iPhone, the smartest phone, started to come into the market in 2017. Once it entered the market, it began to raise its selling. In one year, its sell doubled. In 2019, it represented 25% of all sales. Research shows that the iPhone will replace Samsung after 2 or 3 years. In 2016, Samsung overtook Nokia and represented 65% of all sales in 2019. While Nokia selling almost stopped in 2019 at only 1%. However, the iPhone selling curve started sharply raising and represented 25% in 2019. .

Submitted by jazmin marquez on Thu, 23/04/2020 - 01:16

Permalink
Well, I remember that when I was a child I listened to music on a cassette or even on acetate records. When I was growing up the CD already existed and we used to listen to music as a family. But with time, This phenomenon became more and more individualized, then we downloaded music in Ares, for example. And now, all the music I listen to is streaming, because nowadays it is easier for people to have the Internet and mobile devices.
Profile picture for user Magedelabd

Submitted by Magedelabd on Sat, 11/04/2020 - 12:53

Permalink
The above mentioned graph illustrate my trends in music listening since 2020 till 2020 as a percentage od my free time activities. In 2010 , Listening to music represented 100% of my free time . Then atarted to shrink dramatically till reached zero % in 2020.

Submitted by Rahma Mahmoud on Sun, 29/03/2020 - 09:03

Permalink
I remembered we used to listen to music through CDCs and taps. After the age of the internet, we became using downloads to listen to the latest albums. Now, I frequently use applications like Soundcloud, Spotify, and so on. And the top of them, of course, is Youtube. I think it becomes easier to get into your favorite songs but I still like old trends.

Submitted by Cristy on Fri, 13/03/2020 - 21:09

Permalink
Over the last ten years my music buying habits have changed dramatically. Since 2010 there has been a dramatic decline in CD's purcharses given that streaming became more available. At the begining of 2011 there was a gradual increase on music purchases through applications sold by "Apple Music". Just over 30% accounted for music buys while 70% accounted for free streaming videos in "YouTube". However, the percentage of music spent on "Apple Music" plumetted to 0% in the following years when Spotify Music appeared. From 2014 and onwards, "Spotify" accunted for 100% of the money allocated for music.