Describing a bar chart

Describing a bar chart

Learn how to write about trends in a bar chart.

Do the preparation task first. Then read the text and tips and do the exercises.

Preparation
Reading text

Describing a bar chart

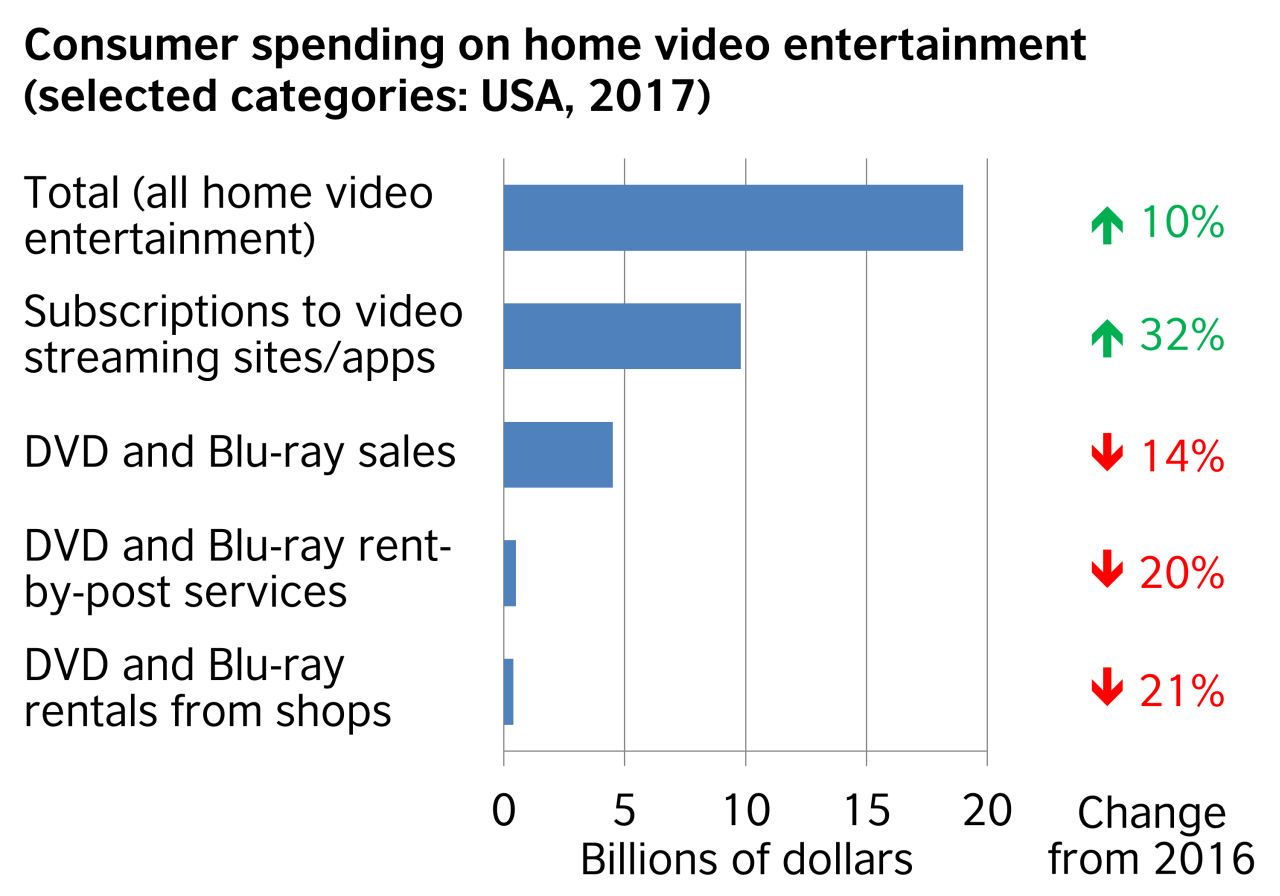
The chart shows the sales revenue of a selection of home video entertainment formats in the USA in 2017. It also shows the percentage change from the previous year.

Online video streaming was the most popular format in 2017. US consumers spent $9.8 billion on services such as Netflix, which was a rise of 32 per cent from the previous year. For the average American, this accounted for nearly half of their spending on video entertainment at home.

At the same time, customers were moving away from the three physical formats in the chart. DVD and Blu-ray sales dropped by 14 per cent over the twelve-month period to $4.5 billion in 2017, and rent-by-post revenues went down by 20 per cent to $0.5 billion. DVD rental shops saw the largest decline, as spending fell by 21 per cent to just $0.4 billion.

Overall, there was a clear downward trend in spending on physical video formats, as they all showed relatively low sales and they were all in decline. However, there was an upward trend in paying for streaming.

Please note: This page was designed for writing practice only. Information in the chart may not be accurate.

Tips

  1. In the first paragraph, give basic details about the chart including what it shows, where it refers to and when.
  2. When you describe chart data, be specific. Mention the category and figure, e.g. Online video streaming was the most popular format in 2017. US consumers spent $9.8 billion ...
  3. A trend is a change over time. To describe trends, focus on what is increasing or decreasing compared to some time in the past, e.g. ... which was a rise of 32 per cent from the previous year.
  4. If several categories show the same trend, talk about them together, e.g. customers were moving away from the three physical formats in the chart.
  5. State the units of measurement, e.g. US consumers spent $9.8 billion.
  6. Many of the verbs for up and down trends can also be used as nouns, e.g. Spending fell by 21 per cent = There was a 21 per cent fall in spending. (You can write % or per cent, but be consistent.)
  7. Write a conclusion. Say what we learn from the data overall.

Task 1

Task 2

Task 3

Discussion

Download
Worksheet209.08 KB

Language level

Average: 4.8 (13 votes)
Profile picture for user Nr.Nuel

Submitted by Nr.Nuel on Thu, 30/04/2020 - 13:19

Permalink
I noticed a trend in 2019 in our country, most of the people who having spent their leisure time through the video watching on YouTube.
Profile picture for user OlaIELTS

Submitted by OlaIELTS on Sat, 25/04/2020 - 23:28

Permalink
An average Nigerian spend their average income on video streaming format of home entertainment.
Profile picture for user Magedelabd

Submitted by Magedelabd on Thu, 26/03/2020 - 15:47

Permalink
I noticed in the way people spend their money in my country in the following , food , internet, phone calls. Setting in the coffee.
Profile picture for user Nikolaos Stavrianakis

Submitted by Nikolaos Stavr… on Thu, 26/03/2020 - 13:27

Permalink
Well, there are basically two types of people. People rich and poor. I have noticed that trends in the way rich people spend their money show growth on clothing and shoes, and on food outside the home. On the contrary trends in the way, poor people spend their money show a decrease in all these above. Nikolaos PS. Hello Kirk, I started my comment Well,...... could you suggest something else instead of well. Nikolaos

Hello Nikolaos

'Well' is a good choice here. If you wanted to be a bit more formal, you could say something like 'In summary'. Or you could refer directly to the chart by saying something like 'What the chart shows is that there are basically two types ...'

All the best

Kirk

The LearnEnglish Team

Submitted by jazmin marquez on Tue, 24/03/2020 - 19:42

Permalink
I have noticed that trends in the way people spend their money in Colombia show growth in spending on education and technology. On the contrary, there was a decrease in the sale of homes because the price of these increased in the last year.

Submitted by M19 on Thu, 05/03/2020 - 14:36

Permalink
There's been an overall increase in the last 5 years. People used to pay money for basic needs only but today they spend most of it on technology. Over a third of their monthly income is used to stream online movies and on playing games.

Submitted by cittàutopica on Thu, 28/11/2019 - 13:01

Permalink
In my country ISTAT (National Statistics Institute), a public research organisation, is the main producer of official statistics in the service of citizens and policy-makers. Istat performs recurring studies also on the way Italians spend their money. In addition to specific surveys, I recommend "Noi Italia.100 statistics to understand the country we live in", which annually offers a general framework for understanding also the social aspects of my country.