Describing a bar chart

Describing a bar chart

Learn how to write about trends in a bar chart.

Do the preparation task first. Then read the text and tips and do the exercises.

Preparation
Reading text

Describing a bar chart

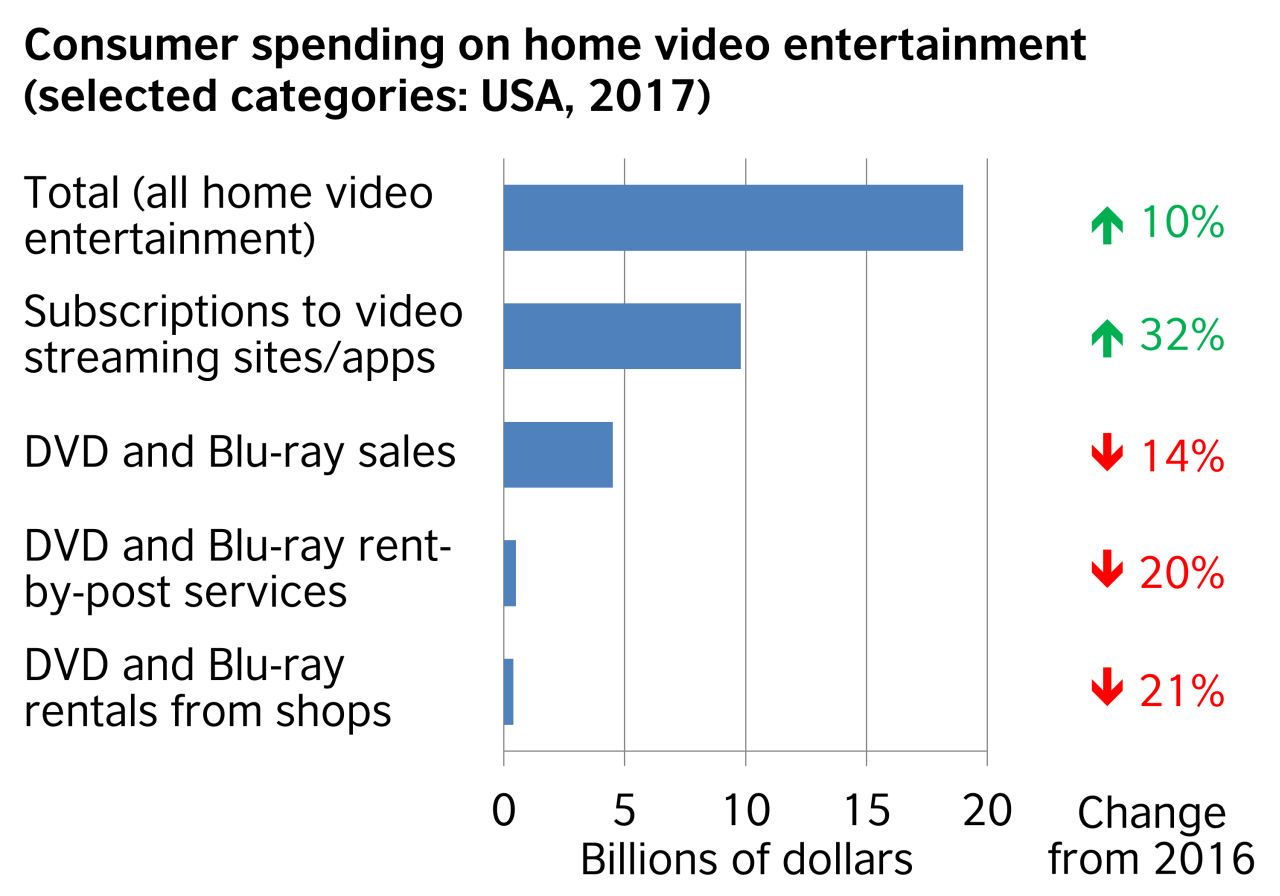
The chart shows the sales revenue of a selection of home video entertainment formats in the USA in 2017. It also shows the percentage change from the previous year.

Online video streaming was the most popular format in 2017. US consumers spent $9.8 billion on services such as Netflix, which was a rise of 32 per cent from the previous year. For the average American, this accounted for nearly half of their spending on video entertainment at home.

At the same time, customers were moving away from the three physical formats in the chart. DVD and Blu-ray sales dropped by 14 per cent over the twelve-month period to $4.5 billion in 2017, and rent-by-post revenues went down by 20 per cent to $0.5 billion. DVD rental shops saw the largest decline, as spending fell by 21 per cent to just $0.4 billion.

Overall, there was a clear downward trend in spending on physical video formats, as they all showed relatively low sales and they were all in decline. However, there was an upward trend in paying for streaming.

Please note: This page was designed for writing practice only. Information in the chart may not be accurate.

Tips

  1. In the first paragraph, give basic details about the chart including what it shows, where it refers to and when.
  2. When you describe chart data, be specific. Mention the category and figure, e.g. Online video streaming was the most popular format in 2017. US consumers spent $9.8 billion ...
  3. A trend is a change over time. To describe trends, focus on what is increasing or decreasing compared to some time in the past, e.g. ... which was a rise of 32 per cent from the previous year.
  4. If several categories show the same trend, talk about them together, e.g. customers were moving away from the three physical formats in the chart.
  5. State the units of measurement, e.g. US consumers spent $9.8 billion.
  6. Many of the verbs for up and down trends can also be used as nouns, e.g. Spending fell by 21 per cent = There was a 21 per cent fall in spending. (You can write % or per cent, but be consistent.)
  7. Write a conclusion. Say what we learn from the data overall.

Task 1

Task 2

Task 3

Discussion

Download
Worksheet209.08 KB

Language level

Average: 4.8 (13 votes)
Do you need to improve your English writing skills?
Join thousands of learners from around the world who are improving their English writing skills with our live online classes and personal tutoring courses.

Submitted by kyawkyawsoezhu on Wed, 02/09/2020 - 16:31

Permalink
I've noted that most businesses spend on online advertising like Facebook ads more than physical or television advertisement like hanging big billboards in the middle of the city.

Submitted by IKEDA on Sat, 29/08/2020 - 16:35

Permalink
I've been thinking that digital consumption is soaring in my country, e.g. purchasing digital items on smartphone games, social tippings like Super Chat on YouTube, and various digital subscription services. While the trend was rising steadily year by year recently, after the Covid-19 pandemic, its growth might be faster than ever.
Profile picture for user Hennadii

Submitted by Hennadii on Thu, 13/08/2020 - 15:17

Permalink
I think my country is in no way different from others in the last trends. We become more digital and less physical. Internet, smartphones and all sort of gadgets changed our life dramatically. We use them more and more day by day. Honestly, I forgot when was the last time I call to order the taxi or pizza. Useful apps on my phone do it without any calls. The same thing with books and movies - you don;t need libraries and DVD rentals anymore. Need to get tickets for the newest film or rail ticket - use your phone. So easy ))

Submitted by mxoubi0 on Tue, 11/08/2020 - 08:13

Permalink
Teacher, please correct me for the below paragraph and what the score I have to get. "The chart shows the statistics of the customers spent on home video entertainment in the USA and the figures are distributed into four categories which are streaming site/apps, DVD Blue-ray sales, DVD rent-by-post service, and DVD rental from shops so those relative amounts between increase and decrease in one year period between 2016 and 2017. Most people used streaming sites/ apps as the figure had increased up to 32% in just a twelve-month period which they spent around $9 billion. On the other hand, the rest of the categories went down as DVD sales decreased by 14% to $4 billion, and the DVD rent by post service declined by 20% to $1 billion also at the same time the DVD rentals from shops dropped down by 21% to just $1 billion."

Hi mxoubi0,

Sorry, we can't give feedback on writing practice here. But if you have a question about a specific word or phrase in it, please feel free to ask. Or, if you are preparing for the IELTS exam, you can find information about preparation courses here: https://learnenglish.britishcouncil.org/IELTS

Best wishes,

Jonathan

The LearnEnglish Team

Submitted by senes19 on Wed, 22/07/2020 - 11:24

Permalink
Recently I have noticed that the tendency of people to spend their money on the internet is increasing. Particularly during the pandemi time this tendency is getting more rising. We also clearly see that people's interest and spending on self-development platforms at home has gone up.

Submitted by Ayano on Wed, 22/07/2020 - 00:27

Permalink
I paid attention to the Net shopping because I thought due to the COVID-19, the number of people who is doing the Net shopping is increase. According to a statistics bureau of the Ministry of Internal Affairs and Communications, expenditure of the Net shopping in a household goes up to about sixteen thousand yen in May in 2020. On May last year, the expenditure was about fourteen thousand yen. From this, I found that it is increasing about two thousand yen in only a year. In addition, percentage of using the Net shopping in a household is also rising. In 2020, this percentage is about 50% in May. In 2019, that is about 42% in May. Why are these number increase? I came up to that it is common for us to have own smartphone and people are able to buy anything even if they are at home. In fact, I bought fashion items, DVDs or CDs, and foods. I didn’t like to use smartphone or internet to buy something because I think it is not safe. However, it was easier than I thought. From such a thing, I thought people tend to buy something via internet. Percentage of using the Net shopping in a household is increasing now. This will increase from now, too. We still have to stay home until the number of patients of the COVID-19 is decrease but people always have something to want. Then, companies to produce things using at home would increase. By this thing, I thought that percentage of using the Net shopping in a household will continue to increase. 

Submitted by Nanako Suzuki on Thu, 16/07/2020 - 09:45

Permalink
I have not some concrete data about how people spend their money in my country, but I think it trends to use sell over the internet and spend their money in Japan when people buy their clothes, livingware, games, foods, machine and so on. Internet is very convenient for many people to buy something which we would like to get even if we do not go to the shops for buying them directly. For example, I often buy and get some two liters mineral water bottles to use 'Amazon' on Internet. I think if would be quite difficult for me to go to buy some two liters plastic bottles to the supermarket directly and bring them home. If you would like to buy not only plastic bottles but also heavy items, if you would like to visit various shops, or if you would not like to go out, online sopping is very good. Various companies are already starting mail-order shopping in Japan. For these reasons, I think many people in Japan spend their money using mail order on Internet. It may be the same in other countries because the Internet is popular all over the world.

Submitted by martin olivares on Sat, 11/07/2020 - 20:11

Permalink
Streaming services have changed my life! First netflix and then prime video. With these platforms i can sit on my couch and spend a whole day just watching series or movies! My first platform was netflix when i was a kid! I can remember the images! a 13 yo boy watching city of god, by the way, the film is really violent! ahhah Nowadays i dont spend much time watching series but i hope i can watch more series soon

Submitted by Yamamoto Yucca on Wed, 01/07/2020 - 03:19

Permalink
I don’t really know about trends that the way people spend their money in my country, but I think Japanese people are often saving money compare to other country. There are many people who often think saving money around me especially. I don’t really know about other country, but I think compared to Japanese people are often economizing. However, I feel young women spend a lot of their money for fashion and sweets in Japan recently. I think most of they are focus on photogenic. I think many young women spend their money for fashionable or cute sweets and café especially. For example, pearl tea is popular in Japan since while ago. Many pearl shops of pearl tea were open and so many people go that shop. Many young women’s enthusiasm is incredible. There is always a long queue in front of shop. I think this trend cannot see other country. I notice trend one more thing. I think Japanese people spend a lot of their money eating out and drinking party. They often held drinking party and they often split the bill evenly.